
4.1 Candlesticks Compress Price Path
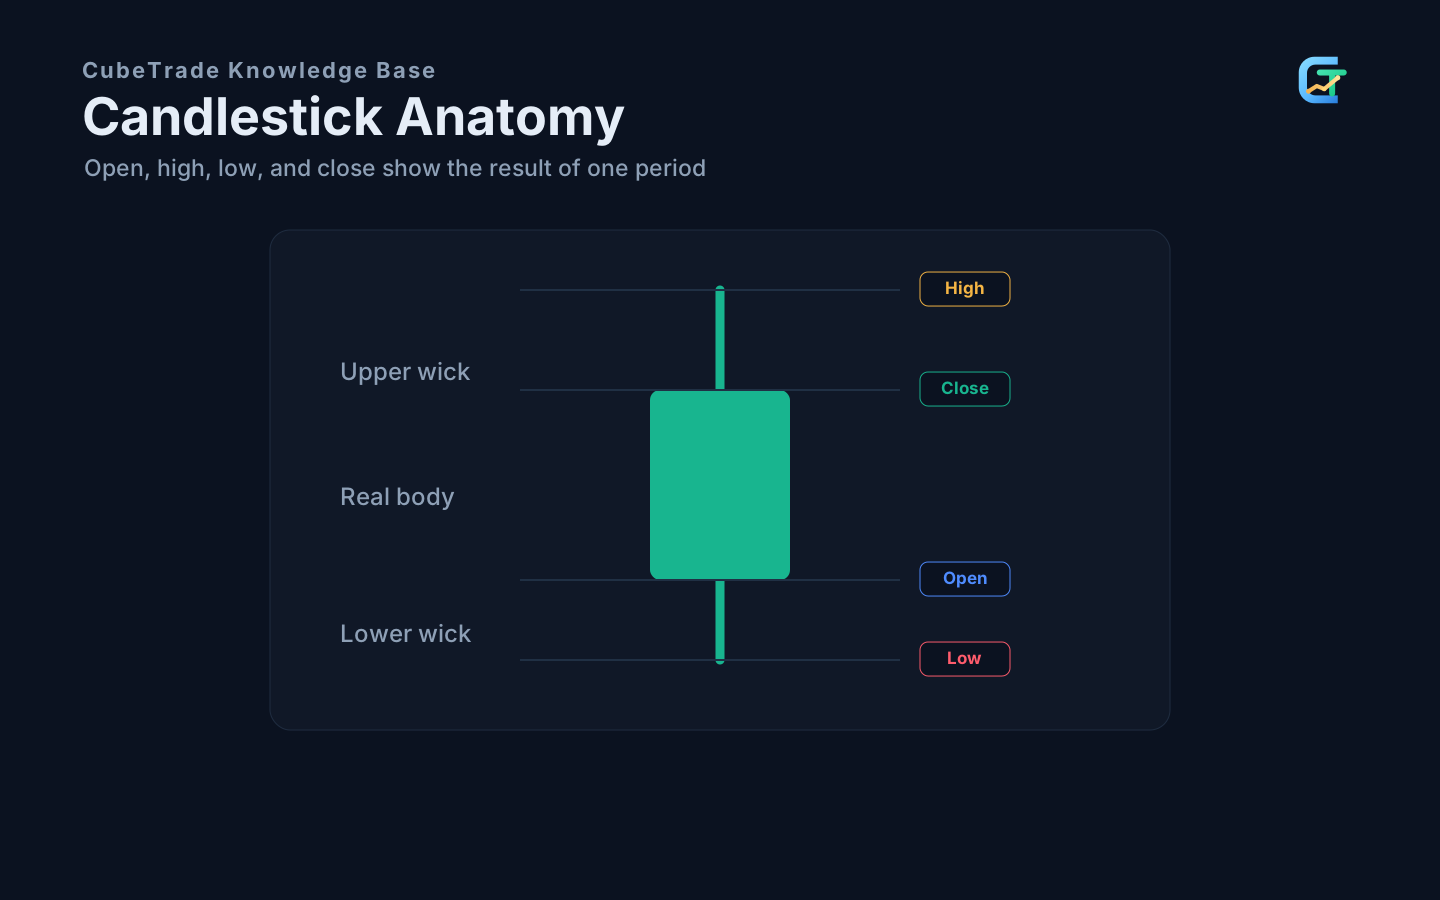
A candle contains open, high, low, and close. But it hides the internal path.
The same long-lower-wick candle may internally be:
- A sharp selloff followed by fast recovery.
- A gradual test lower and slow reclaim.
- Low-level consolidation followed by a late push up.
Similar appearance does not guarantee the same buyer-seller process. Candles should not be used without location and later confirmation. A single candle only shows the result of that period; it does not prove what the next move must do.
4.2 Reading Candlesticks
Do not start from candle names. Start from context.
You can read it this way:
- Where does it appear?
- What trend is it in?
- Does it close near the high, low, or middle?
- Is the body large?
- Which side failed according to the wick?
- Is there later confirmation?
The same long upper wick:
- At resistance after a rally may show supply.
- During a downtrend may be a failed bounce.
- In the middle of a range may mean little.
4.3 Long Lower Wick, Hammer, and Demand
A long lower wick means price was pushed down, but buyers pulled it back.
To become a useful demand signal, a long lower wick needs at least:
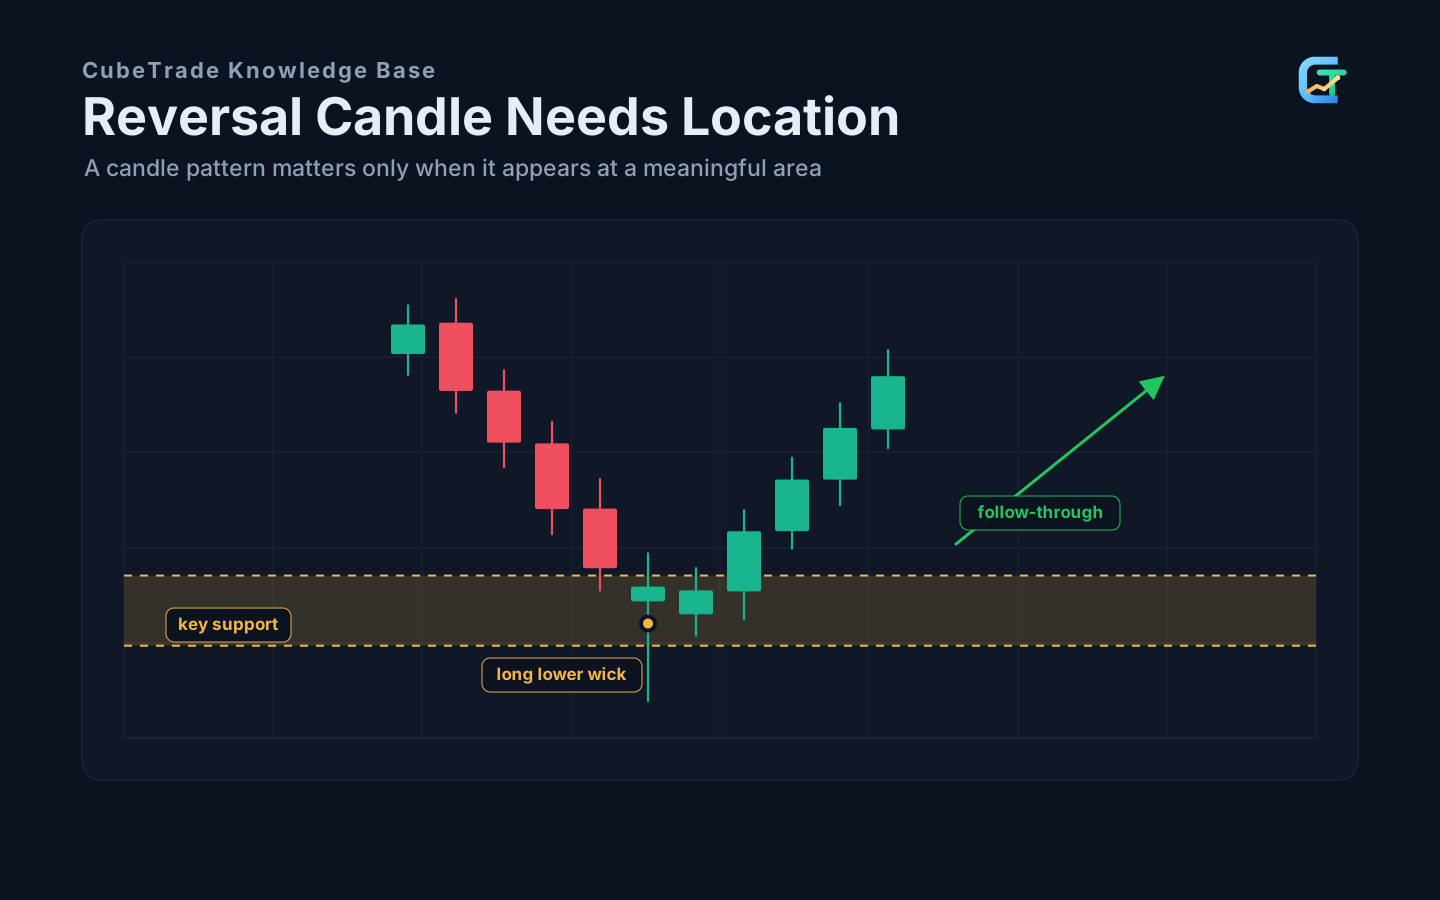
- It appears at key support, near the end of a pullback, or after a false breakdown, not at a random location.
- The lower wick represents failed selling, and the close returns above support or back inside the range.
- If it appears repeatedly in the same area, buyers are defending the area more than once.
- Later candles continue upward, or lower-timeframe structure turns, confirming buyers did more than react once.
A hammer is a common long-lower-wick candle used to observe demand near the end of a decline or near support.
But a long lower wick is not a buy guarantee. It only tells you buyers fought back. If the next candle cannot continue and price falls below support again, the wick may have been only a temporary bounce. Before it becomes part of a plan, the stop usually needs to be below the wick low or the structure-failure point.
4.4 Long Upper Wick, Shooting Star, and Supply
A long upper wick means price was pushed up, but sellers drove it back down.
To become a useful supply signal, a long upper wick needs at least:
- It appears at key resistance, after a continuous rally, or after a false breakout.
- The upper wick represents failed buying, and the close cannot hold above resistance.
- Later price breaks the candle low, showing sellers are taking control rather than only causing a temporary rejection.
- If volume stalls or momentum diverges at the same time, the supply signal becomes more meaningful.
A shooting star describes failed upside pressure near the end of a rally. An inverted hammer and shooting star may look similar, but context separates them. If a long upper wick appears in the middle of a range, or price later reclaims the wick high, do not treat it as a high-quality bearish signal.
4.5 Doji Is Not a Reversal Signal
A doji represents temporary balance and hesitation.
Its meaning depends on location:
- At the end of a trend, it may suggest slowing momentum.
- At a key level, it may suggest waiting for direction.
- In the middle of a range, it may mean little.
A doji itself is not an entry reason. It is a warning light, not an action button.
4.6 Engulfing Depends on Close and Context
An engulfing pattern means the later candle covers the previous one and suggests short-term force change. But it does not mean “engulfing equals reversal.” Ask whether the engulfing candle changed the key location and short-term rhythm.
But do not judge only by whether it “engulfs.” Ask:
- Where does it appear?
- Is it near the end of a trend?
- Is volume present?
- Is the close strong or weak enough?
- Is there follow-through?
Bearish engulfing especially requires the close to press into the previous candle’s lower area and fall back below a key level. The weaker the close, the clearer seller control. Bullish engulfing should reclaim key support or a false-breakdown area. If the engulfing pattern appears in the middle of a range, has a small body, long wicks, or no follow-through, treat it as noise.
Engulfing is most often misused by judging only its appearance. A truly forceful bearish engulfing is not merely a bearish candle covering a bullish one. It should close near the low, ideally back below resistance, the previous candle’s lower area, or short-term support. If it covers the body but closes in the middle, sellers have not fully taken control and quality drops. Bullish engulfing is the same: it is not just a larger bullish candle, but a candle that rejects the seller attempt and reclaims key support, a false-breakdown area, or short-term resistance.
4.7 Candle Strength
Strong candles should be judged by at least four things:
- Large body.
- Close near high or low.
- Small wicks.
- Break of previous candle structure.
Weak candles usually show the opposite:
- Small body.
- Long wicks.
- Close in the middle.
- Failed test and reversal.
Candle strength is not color alone. It is closing location and whether one side controlled the period. A strong candle matters more when it appears at a breakout, retest confirmation, or reversal confirmation area. In the middle of nowhere, it may simply be chase risk.
4.8 Reversal Candles Need Something to Reverse
Many traders see hammers, engulfing candles, or doji and call reversal. That is wrong. A reversal candle needs a prior move to reverse.
For example:
- After a decline, a long lower wick at support may show failed selling.
- After a rally, a long upper wick at resistance may show failed buying.
- In the middle of a range, a doji is usually noise.
Ask:
- Was there a clear move before it?
- Did it appear at a key location?
- Did it change the rhythm of that move?
- Did the next candle confirm?
Without trend context or key location, a beautiful candle name has little value.
4.9 High-Quality Engulfing Conditions
The core of engulfing is not that one candle covers another. It is that one side tried, failed, and the other side took control.
High-quality bullish engulfing usually has:
- It appears at support, the end of a pullback, or after a false breakdown.
- The previous candle represents seller attempt.
- The bullish candle has a large body and closes near the high.
- It reclaims the key area, not just the previous body.
- Later price can break short-term resistance.
High-quality bearish engulfing usually has:
- It appears at resistance, the end of a rally, or after a false breakout.
- The previous candle represents buyer attempt.
- The bearish candle has a large body and closes near the low.
- It falls back below the key area.
- Later price breaks short-term support.
Low-quality engulfing patterns often appear in the middle of a range, have small bodies, long wicks, or no directional close. Even high-quality engulfing is not an automatic entry. The stop still needs to sit beyond the structure-failure point, and target space must be sufficient.
Volume can improve signal credibility, but it cannot replace location and close. A high-volume engulfing pattern in the middle of a range may still be random turnover. An ordinary-volume engulfing pattern at a major key level with later candle confirmation may have more trading value.
4.10 Sandwich Candles and Local Conflict
A “sandwich” candle can be understood as short-term conflict: a middle candle is surrounded by stronger candles in the opposite direction. Its value is not the name, but the display of failed test and opposite takeover.
Use it by checking:
- Does it happen near support/resistance?
- Was the middle candle a failed breakout or breakdown?
- Did the last candle clearly reclaim the key area?
If price breaks above resistance and fails, then a strong bearish candle pushes it back below, trapped buyers may exist. Conversely, if price breaks below support and reclaims strongly, trapped sellers may exist.
If sandwich candles are used in a trade plan, trigger and invalidation must be written clearly. For longs, usually wait for the last candle to reclaim the key level, or for price to break the middle rebound candle’s high, then place the stop below the lowest point of the candle group or below the support-failure point. For shorts, the logic is reversed: wait for price to break the middle rebound candle’s low or fall back below the key level, and place the stop above the group high or resistance-failure point.
Without a key location, final candle confirmation, and a clear stop boundary, a sandwich structure is only local conflict. It is not an entry reason.
4.11 Common Mistakes in Candle Confirmation
Mistake one: looking only at shape, not location.
Location determines signal value. A long upper wick at resistance differs from one in the middle of a range.
Mistake two: looking at one candle, not the sequence.
One candle is the result of one period. Later candles decide whether the market accepts that result.
Mistake three: treating reversal candles as trend endings.
In strong trends, many reversal candles are only pauses. Without structural break, do not declare trend over.
Mistake four: ignoring close.
The close shows who controlled the period in the end. Wicks can look dramatic, but closing location matters more.
4.12 Practice
Find ten candles you think are beautiful signals. For each one, answer:
- Is it in a trend, range, or transition?
- Is it near key support/resistance?
- Is the close strong?
- Did the next candle confirm?
- If entered, where should the stop be?
You will find that many candles look similar but have very different trade quality.