
2.1 Markets Have Only a Few Basic States
Every trade judgment must begin with market state. Market state is not a feeling. It is judged by whether price structure is continuous, whether key boundaries are clear, and whether breakouts are accepted by the market. Common states include:
- Uptrend
- Downtrend
- Range
- Transition phase
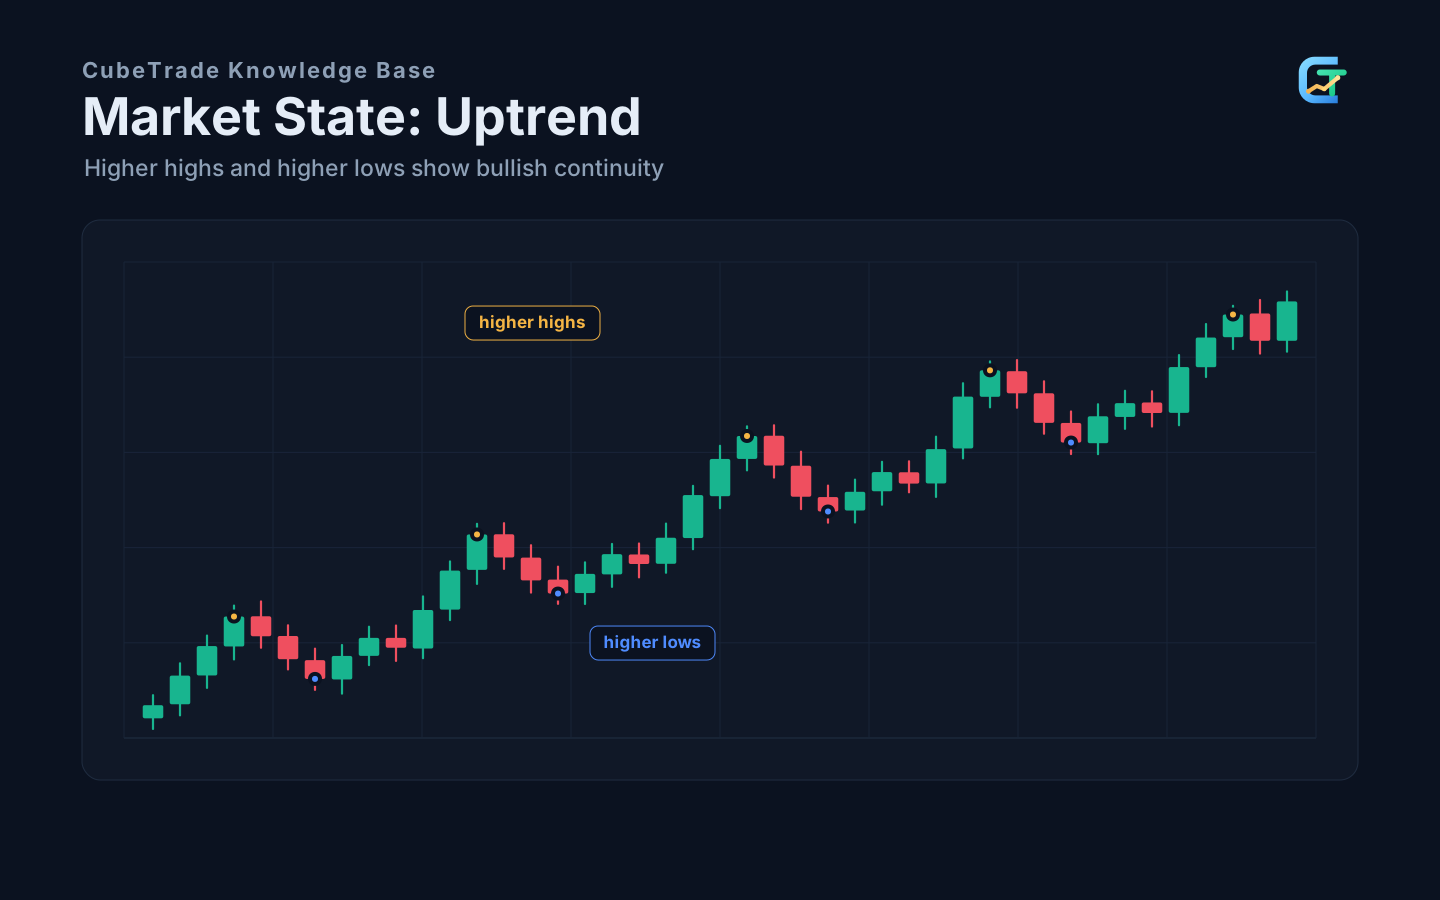
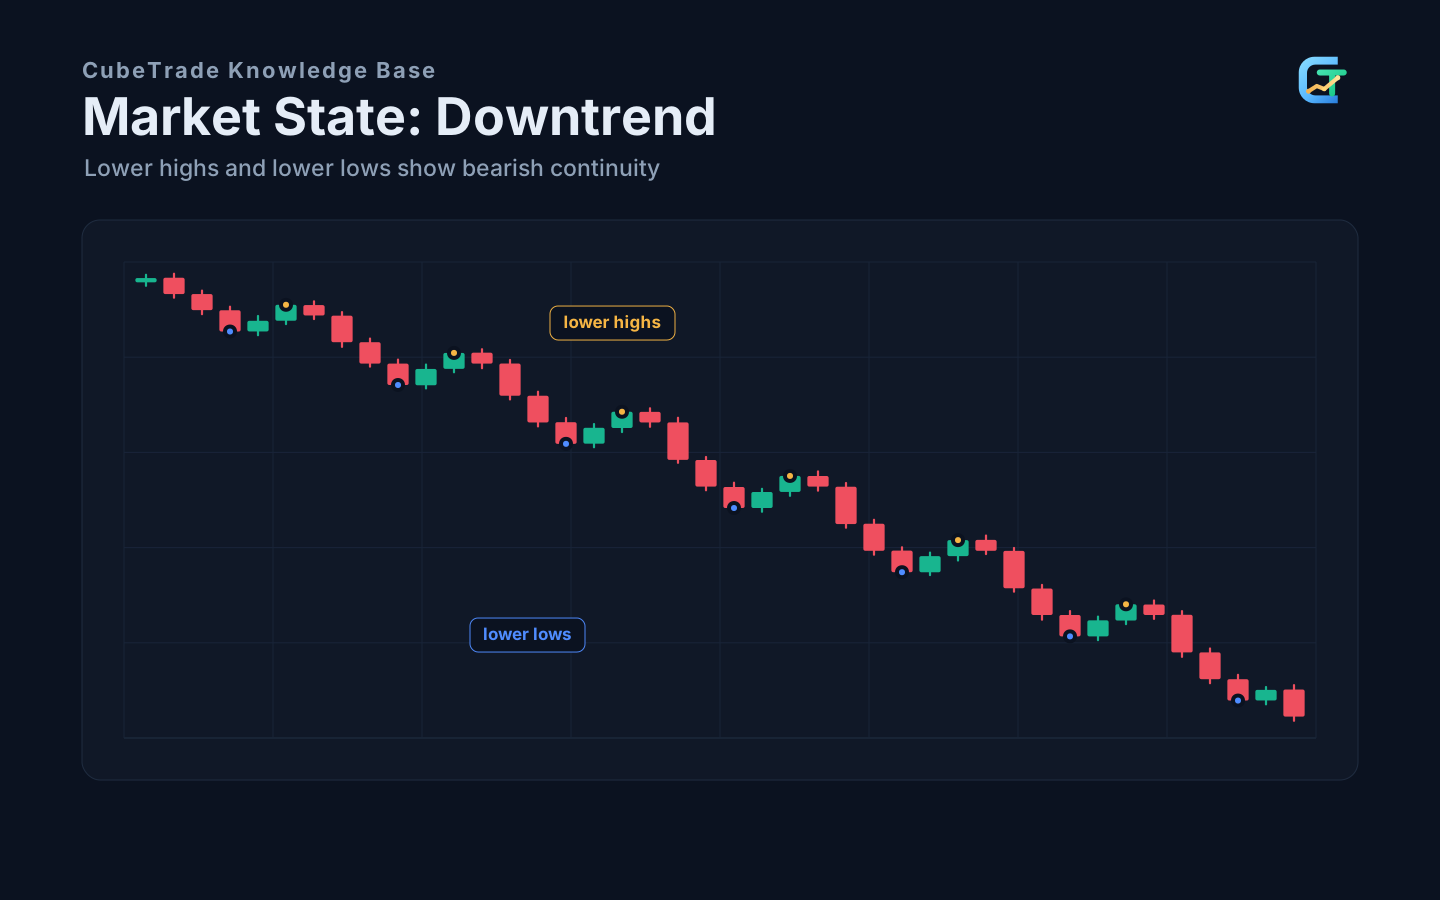
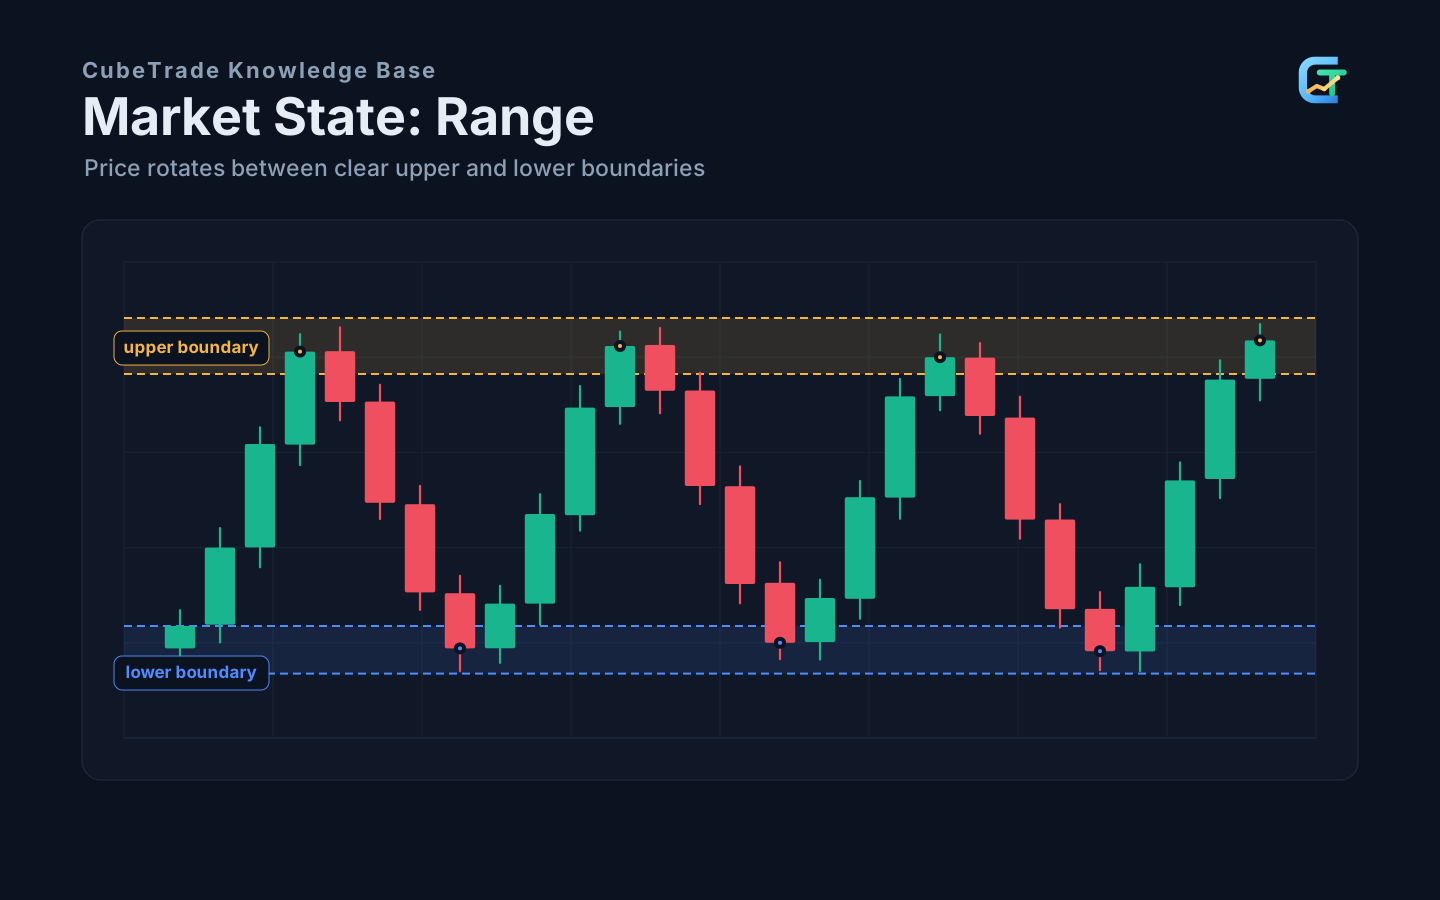
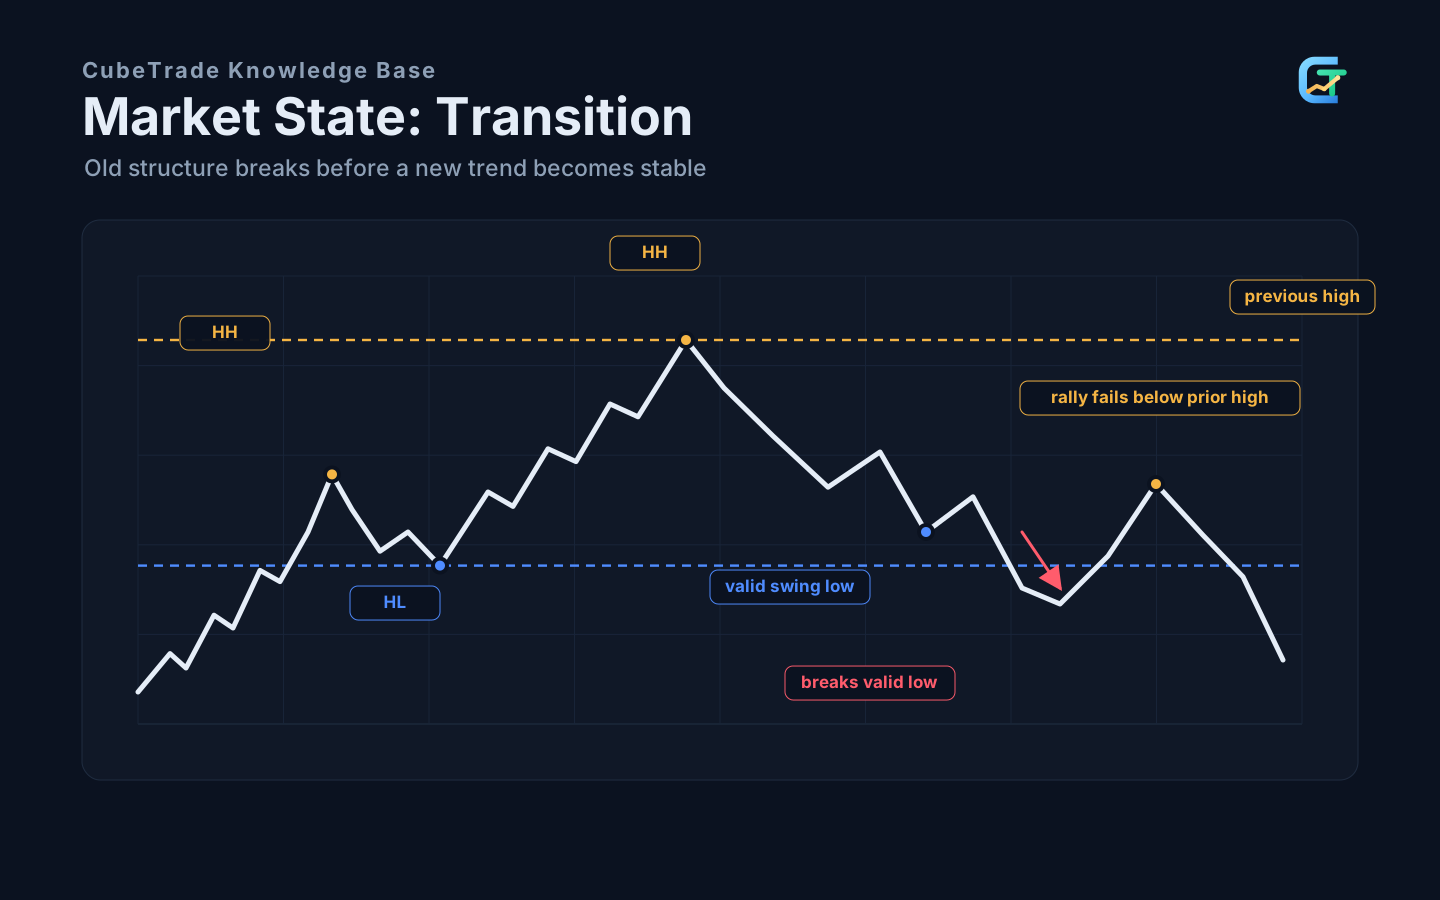
An uptrend is defined by higher highs and higher lows. A downtrend is defined by lower highs and lower lows. A range is defined by repeated movement between upper and lower boundaries. A transition phase is when the old structure has been broken but the new trend is not stable yet.
Many bad trades come from misreading state:
- Chasing breakouts in range markets.
- Trying to pick tops or bottoms in trend markets.
- Treating pullbacks as reversals.
- Treating early reversals as ordinary pullbacks.
If the state is unclear, the best response is not to force a label. Reduce trading frequency and wait until swing structure, range boundaries, or key-level reactions become clearer.
Different states favor different tools. Trending markets prioritize structure, pullbacks, and continuation. Ranging markets prioritize boundaries, reactions, and repeated confirmation. Transition phases are better handled with smaller size, shorter expectations, and only plans with clear invalidation.
2.2 Trend Recognition: Swing Structure Comes First
When identifying trend, swing highs and lows matter more than any moving average or trendline.
An uptrend needs these structural conditions:
- Price keeps breaking previous highs, forming higher highs.
- Each pullback low remains above the previous low, forming higher lows.
- Retests after breakouts hold the old key area, showing buyers are willing to accept higher prices.
- Even when price pulls back, the rhythm of higher highs and higher lows remains intact.
A downtrend is the opposite:
- Rally highs become lower, showing buyers cannot push price back to previous highs.
- Selloff lows keep refreshing, showing sellers still control direction.
- Rallies are capped by former support, moving averages, or trendlines; old support may become resistance.
- Structure continues to show lower highs and lower lows.
Trendlines and moving averages are support tools. They make the trend more visible, but they do not replace structure.
The warning sign for trend failure is not one candle piercing a trendline. It is broken structural continuity. In an uptrend, if price can no longer make a new high and effectively breaks the previous low, the trend may be weakening or reversing. In a downtrend, if price can no longer make a new low and effectively breaks the previous high, bearish rhythm may be broken.
Trendlines and moving averages help observation, but swing structure comes first. If a trendline is briefly pierced but swing structure remains intact, the trend may not be over. If moving averages have not crossed yet but price structure has already weakened, do not pretend the trend is healthy.
2.3 A Pullback Is Not a Reversal
A pullback is a normal counter-move within a trend. A reversal is a break in trend structure. The difference is not how far price fell, but whether the original trend rhythm still holds.
In an uptrend, a high-quality pullback needs these conditions:
- It does not effectively break the key previous low or main support, and lows remain higher.
- It reaches a meaningful location, such as a previous-high retest, trendline, moving average, or support area.
- Buyers still resist the pullback; candles are not a continuous, rhythmless drive downward.
- Demand appears there, and price can break short-term resistance when it rises again.
- After the bounce, price can return to the original trend rhythm instead of being rejected from lower and lower areas each time.
A reversal requires structural changes:
- Highs stop making new highs, showing the original advance has weakened.
- Price effectively breaks the previous low and important support fails.
- After the break, rebounds cannot reclaim the level; old support or the trendline becomes resistance.
- Later rallies become weaker, and both highs and lows begin moving lower.
Do not judge pullback versus reversal by “how much it fell.” Judge whether structure has been broken. As long as highs and lows still align with the old trend and price can return to the original rhythm, it is closer to a pullback. Once a key low breaks, rebounds cannot reclaim, and old support becomes resistance, reversal validation begins.
A fast drop is not automatically a reversal. If the decline still stops above the previous low, then price reclaims the trendline or moving-average area and breaks short-term resistance, it may still be a deep pullback. In contrast, if the decline has no rhythm, shows little resistance, cuts straight through support, and later rebounds cannot reclaim the lost ground, do not comfort yourself by calling it a normal pullback.
2.4 Surges and Crashes Depend on Timeframe
The same move has different meanings on different timeframes.
On a 30-second chart, one large bearish candle may look like a crash. On a 4-hour chart, it may be a normal retest. On a daily chart, it may barely be visible.
You must define your trading timeframe first:
- Short-term trading uses lower timeframes but contains more noise.
- Swing trading uses hourly to daily charts and focuses on structure.
- Trend trading uses higher timeframes and tolerates larger pullbacks.
Timeframe confusion causes decision confusion. Entering on a five-minute chart and using the daily chart as an excuse not to stop is a common mistake.
2.5 The Three Stages of a Trend: Start, Advance, Exhaustion
A trend is not a straight line. It often has three stages.
First, the starting stage.
The old structure is broken, but the new trend is not yet widely accepted. Price may have just broken out of a range, broken a swing high/low, or completed a false-break reversal. In this stage, focus on whether the breakout holds, whether the retest holds, and whether later highs and lows begin to align in the new direction. A breakout without structural confirmation is still only an early signal.
Second, the advancing stage.
Trend structure is clear. Pullbacks hold, and breakouts follow through. Trend-following trades are best suited here. The trader does not need to guess tops and bottoms, but should wait for pullback, key-level reaction, entry trigger, and place the stop beyond the structure-failure point.
Third, the exhaustion stage.
Price may still make new highs or lows, but momentum begins to weaken. Common signs include:
- New highs become smaller.
- Pullbacks become deeper.
- Breakouts quickly fail.
- Long upper or lower wicks increase.
- Divergences appear more often.
- Volume no longer supports continuation.
Exhaustion does not mean immediate reversal. It only means the quality of the trend has declined. A real reversal still needs key-level failure, failed retest, or a change in swing order.
2.6 Range Logic
A range is not “no market.” It is another type of market. A range means the market has not accepted higher or lower price areas for now, and price keeps rotating between boundaries.
Common range methods:
- Observe support reaction near the lower boundary.
- Observe resistance reaction near the upper boundary.
- Avoid the middle.
- Wait for confirmation after boundary breakouts instead of chasing.
The two biggest range mistakes are trading in the middle and assuming every boundary touch will break out. The advantage of range trading comes from short stops and clear targets near boundaries.
2.7 Trend Markets and Range Markets Use Tools Differently
The same tool means different things in different states.
In a trend market:
- Moving averages act like dynamic support/resistance.
- Breakouts are more likely to continue.
- RSI overbought or oversold can last.
- Bollinger Band breaks may indicate acceleration.
- Trend pullbacks are better than countertrend picking.
In a range market:
- Horizontal support and resistance matter more.
- False breakouts are more common.
- RSI overbought/oversold can be more useful.
- Bollinger upper/lower bands may be boundary areas.
- Chasing breakouts often buys the top or sells the bottom.
The issue is not whether an indicator is good or bad. The issue is whether you judged market state first.
2.8 Transition Is the Hardest Phase
Transition means the old trend has been damaged but the new trend is not stable. It must be separated from an ordinary pullback: a normal pullback does not damage the main structure; transition has begun to damage the old structure, but the new direction has not been confirmed. It often looks like:
- An uptrend begins breaking lows.
- A downtrend begins breaking highs.
- Range boundaries are repeatedly pierced.
- Trendlines, moving averages, and support/resistance conflict.
This phase creates the illusion that everything can be traded. In reality, it is better to reduce frequency and wait for the market to choose direction.
If you trade transition phases, reduce size, shorten expectations, and require a clear invalidation point. Without invalidation, transition trading easily becomes emotional gambling. The cleaner approach is to wait for second confirmation, such as a breakdown followed by a failed reclaim, or a false breakdown followed by reclaiming the range and breaking short-term resistance.
In transition phases, reversal candles are often only pauses, and breakout signals are often only probes. Until the new direction holds, do not treat one pierce or one reclaim as a complete trend.
2.9 Market-State Checklist
Before every chart read, ask:
- Are the last two highs higher, lower, or flat?
- Are the last two lows higher, lower, or flat?
- Is price inside a clear range?
- Did the last breakout continue or return to the range?
- Did the pullback hold the previous low or key support?
- Did the rally break the previous high or key resistance?
- How far is current price from major support/resistance?
- Are the higher timeframe and trading timeframe aligned?
This checklist is not mechanical scoring. It prevents you from skipping the most important first step.
2.10 Practice
Choose three timeframes for the same instrument, such as daily, one-hour, and 15-minute. Write:
- What state the higher timeframe is in.
- What state the trading timeframe is in.
- Whether the lower timeframe is noise or has changed the trading-timeframe structure.
Then check a signal you originally wanted to trade and see whether it agrees across the three timeframes. Many losing trades happen not because signals are absent, but because timeframes conflict.