
5.1 Patterns Are Not Prediction Tools
Patterns are labels for market structure and rhythm, not future predictors. Their value is not whether the shape looks familiar, but whether they provide a clear boundary, trigger, stop, and invalidation condition.
The same pattern has different meaning in different locations:
- A flag in an uptrend may be continuation.
- A false breakout after high-level range may be a bull trap.
- A falling wedge near the end of a decline may show seller exhaustion.
Judgment sequence:
- Trend background first.
- Pattern location second.
- Boundary clarity third.
- Breakout/breakdown confirmation fourth.
- Shape standardization last.
Imperfect patterns are normal. Markets do not always draw clean standard examples. Before a pattern is complete, do not treat it as a signal. It becomes useful for planning only when the boundary breaks, price holds, the retest confirms, and the risk boundary is clear.
5.2 Top Reversals: Double Top, Triple Top, Head and Shoulders
The common essence of top reversal structures is failed repeated buyer attempts.
Double top:
- First rally meets resistance.
- Second rally cannot break through.
- After neckline breaks, the structure is more complete.
Triple top:
- Three attempts fail in the same area.
- Momentum weakens each time.
- When lower support breaks, confidence fades.
Head and shoulders:
- Left shoulder: first failed rally.
- Head: final higher push.
- Right shoulder: buyers cannot recover strength.
- Neckline break confirms structural weakness.
These patterns are not for guessing tops. They help identify failed buyer attempts. A top reversal enters planning only after key resistance repeatedly rejects price, the second or third attempt weakens, and the neckline or support breaks. Similar shape without breakdown confirmation is not a complete top.
If the neckline has not failed, a double top or head-and-shoulders top is only an observation object. If price breaks below the neckline and quickly reclaims, the top structure loses credibility. When trading top reversals, what matters is whether price can keep weakening after the failure, not whether the shape resembles a textbook.
5.3 Bottom Reversals: Double Bottom and Falling Wedge
Bottom reversal is not because price has fallen a lot. It is because sellers can no longer push effectively.
Double bottom:
- The second low does not effectively break the first low.
- Price breaks the neckline.
- Retest after breakout holds.
Falling wedge:
- Price continues down, but volatility contracts.
- Each new low lacks continuation.
- When the upper boundary breaks, seller pressure may be exhausted.
Before confirmation, bottom structures are observation objects, not buy commands. A high-quality bottom reversal needs sellers to fail at making a valid new low, the neckline or short-term resistance to break, and the breakout retest to hold. A large decline alone does not create a bottom pattern.
If the second low effectively breaks the first low, it is not a double bottom. If a falling wedge breaks down and cannot reclaim, it is not a direct long signal. The value of a bottom pattern is whether buyers really take control after seller failure, not simple visual symmetry.
5.4 Continuation Patterns: Triangle, Range, Wedge, Flag
Continuation patterns mean the trend pauses, not necessarily ends.
Common continuation structures:
- Ascending triangle: fixed resistance, rising lows.
- Range: price rotates between support and resistance.
- Symmetrical triangle: volatility contracts and waits for direction.
- Flag: short consolidation after strong trend.
- Wedge: contraction with momentum change.
Do not trade inside continuation structures too early. Opportunities usually come after breakout, breakdown, or retest confirmation. To judge whether continuation is worth participating in, check at least three things: the original trend remains intact, the consolidation has not damaged the main structure, and the breakout direction agrees with trend and available space.
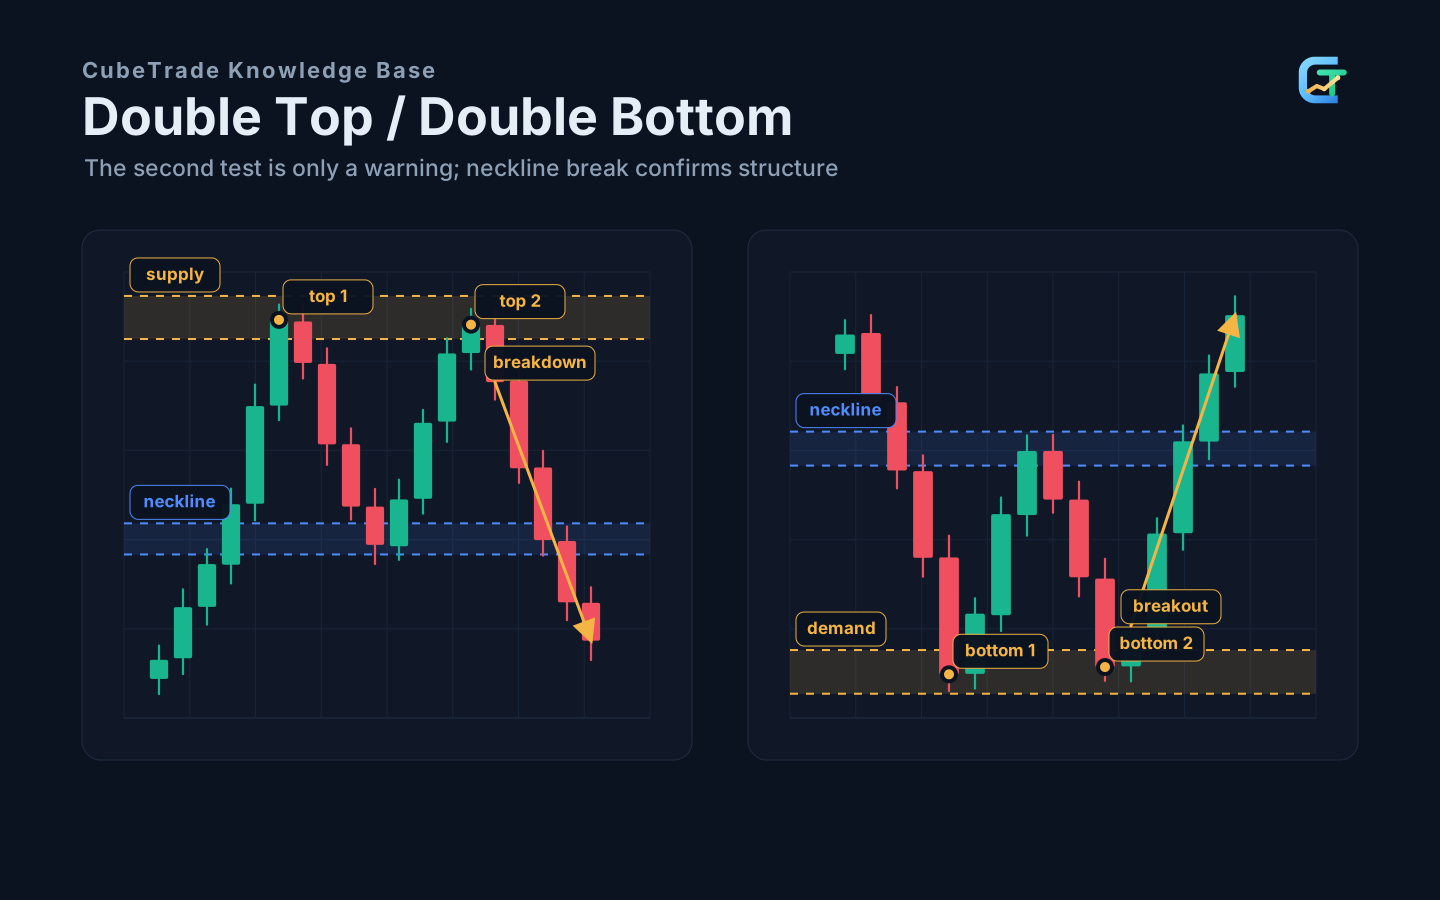
5.5 Full Reading of Double Tops and Double Bottoms
A double top is not “two similar highs.” It is the failure of the second upward attempt.
A fuller double-top process:
- Price rises to resistance and forms the first high.
- Price pulls back to support, forming neckline or middle low.
- Price rallies again near resistance but cannot break effectively.
- The second rally shows weak candles, long upper wick, engulfing, or divergence.
- After neckline break, the top structure is more complete.
- A failed retest of the neckline is more conservative confirmation.
Double bottom is the opposite:
- Price falls to support and forms the first low.
- Price rebounds to resistance, forming the neckline.
- Price tests support again but cannot break effectively.
- The second test shows long lower wick, bullish engulfing, or divergence.
- After neckline breakout, the bottom structure is more complete.
- A successful retest of the neckline is more conservative confirmation.
Do not trade the “second top” or “second bottom” too early unless you know you are trading a short-term boundary reaction, not a complete reversal. A complete reversal plan must wait for neckline break or breakout; a more conservative version waits for retest confirmation. Stops should sit where the structure becomes invalid, such as above the right high of a double top or below the right low of a double bottom.
5.6 Head and Shoulders Is About Force, Not Shape
Head and shoulders is often over-subjectively identified. What matters is declining force.
In head and shoulders top:
- Left shoulder shows the first resistance.
- Head shows buyers can still make a new high, but the pullback is clear.
- Right shoulder shows buyers cannot recover to head height.
- Neckline break shows buyer defense failed.
In inverse head and shoulders:
- Left shoulder shows first demand.
- Head shows sellers can make a new low but cannot continue.
- Right shoulder shows sellers cannot make another new low.
- Neckline breakout shows seller defense failed.
Symmetry is not required. What matters is whether high-low structure shows exhaustion and neckline confirmation. Before the neckline breaks, the pattern only says it may be forming; it does not prove reversal has happened.
5.7 Triangles: Compression Is Not Direction
All triangles share volatility compression. Compression itself does not say up or down.
Ascending triangle:
- Upper resistance is relatively horizontal.
- Lower lows rise.
- Buyers step in at higher prices.
- Only after upper breakout does confirmation begin.
Descending triangle:
- Lower support is relatively horizontal.
- Highs decline.
- Sellers pressure at lower prices.
- Only after lower break does confirmation begin.
Symmetrical triangle:
- Highs lower, lows higher.
- Both sides compress.
- Direction depends more on breakout confirmation.
Triangle trading focuses on clear boundaries, contraction, valid breakout, and retest. Trading randomly inside a triangle is easy to get whipsawed. If the breakout direction immediately runs into higher-timeframe support/resistance, or price quickly returns inside the triangle, it is not a high-quality triangle breakout.
If a triangle does not break for a long time, the market is still compressing rather than choosing direction. The pattern is not an invitation to guess early. It is a reminder to prepare boundaries, stops, and waiting conditions. The first candle after breakout is not the end of the process; the key is whether later price action keeps accepting the new price.
5.8 Wedges: Momentum Exhaustion Structures
Wedges and triangles can both contract, but wedges emphasize exhaustion during directional movement.
In a rising wedge, price still rises, but each rally becomes smaller and support becomes steeper. Buyers are still pushing, but with more cost. Once the lower boundary breaks, a pullback can follow.
In a falling wedge, price still falls, but each decline becomes smaller. Sellers remain in control but lose continuation power. Once the upper boundary breaks, a rebound may appear.
A wedge is not automatic reversal. It must be combined with location, volume, breakout, and structure confirmation. A rising wedge enters bearish validation only after the lower boundary breaks and cannot be reclaimed. A falling wedge enters bullish validation only after the upper boundary breaks and the retest holds.
If a wedge only contracts without a key location or clear momentum exhaustion, it is closer to ordinary compression. The trading value of a wedge comes from whether the final push is truly weakening, not from two lines looking attractive.
5.9 Pattern Target Estimation
Common target methods:
- Double top/bottom: measure from top/bottom to neckline, then project after break.
- Head and shoulders: measure head to neckline, then project after break.
- Range breakout: project range height.
- Triangle breakout: use widest height or recent swing size.
Targets are references, not promises. Actual exits should consider:
- Previous highs/lows.
- Higher-timeframe support/resistance.
- Reward-to-risk.
- Price reaction before target.
- Holding period and volatility.
If the theoretical target is far but strong resistance appears earlier, or reward is already enough, you do not need to force a standard-pattern target. Before entry, reward-to-risk must be checked first. If structural stop placement leaves insufficient target space, the pattern should be skipped even if it looks clean.
5.10 Practice
Find five patterns on historical charts. Do not only screenshot the final look. Write the formation process:
- What was the market state before the pattern?
- Were boundaries clear?
- Did momentum change inside the pattern?
- Where did breakout or breakdown happen?
- Was retest confirmed?
- Where was the failure signal?
This trains you to read structure instead of hunting shapes.