
This chapter explains the basic logic of risk and position sizing. To see how CubeTrade applies those principles to the entry window, first take-profit, and protection tracking, continue with the Risk Guide: why single-trade risk must be defined first.
8.1 Reward-to-Risk and Win Rate
Trading is not about being right every time. It is about making gains cover losses.
Breakeven win rate formula:
Win rate = 1 / (1 + reward-to-risk)If reward-to-risk is 2:1, theoretical breakeven win rate is about 33.3%. If reward-to-risk is 1:1, theoretical breakeven win rate is 50%.
Real trading must also include fees, slippage, funding costs, funding rates, overnight gaps, and execution errors, so the real requirement is higher.
This formula only gives theoretical breakeven. It does not mean a strategy will make money. If your losses often exceed plan, winners are cut early, or entries suffer slippage, the real breakeven win rate will be higher than the paper number.
Before entry, at least three things must be clear:
- Where the stop is, and why that location means the trade idea has failed.
- Where the target is, and why price has a reasonable path to reach it.
- Whether reward-to-risk still meets your trading manual after costs.
No-trade conditions:
- The stop is based on feeling, not on a structural invalidation point.
- The target is only a desired profit number, with no basis in prior highs/lows, support/resistance, measured move, or volatility range.
- Paper reward-to-risk is acceptable, but after fees, slippage, and possible gaps it is not.
- The stop is moved closer only to make reward-to-risk look better, even though normal noise can easily hit it.
8.2 Drawdown Is More Dangerous Than a Single Loss
The larger the loss, the harder it is to recover.
Lose 10%, you need about 11.1% to recover. Lose 50%, you need 100%. Lose 70%, you need about 233%.
The most important thing is not catching every opportunity, but avoiding one loss that destroys the account.
Drawdown control should be written as rules before losses happen. Common boundaries include:
- Maximum daily loss; once reached, stop trading for the day.
- Maximum weekly loss; once reached, reduce frequency or only review.
- Consecutive-loss limit; once reached, pause new trades and review market state and execution quality.
- Account drawdown limit; once reached, stop live trading and return to simulation or smaller size.
If the loss limit has already been reached and you are still looking for “one trade to make it back,” that is not an opportunity. It is discipline failure.
8.3 Trading Discipline
Common bad habits:
- Overtrading.
- Not following plan.
- Fear of missing out.
- Revenge trading.
- No review.
- Moving stops randomly.
Discipline is not a slogan. It is part of the system. Review, rest, and trade-frequency limits help the system recover.
Discipline must become checkable actions:
- Before entry, write the model, location, trigger, stop, target, and size.
- If the trigger has not occurred, do not enter early just because price is moving fast.
- After a stop is hit, do not immediately reverse or double size with the same reasoning.
- Once the daily trade limit is reached, stop looking for “exceptional” trades.
- After each trade, record it before judging the next one; do not stack decisions without review.
8.4 R-Multiple: One Ruler for Different Trades
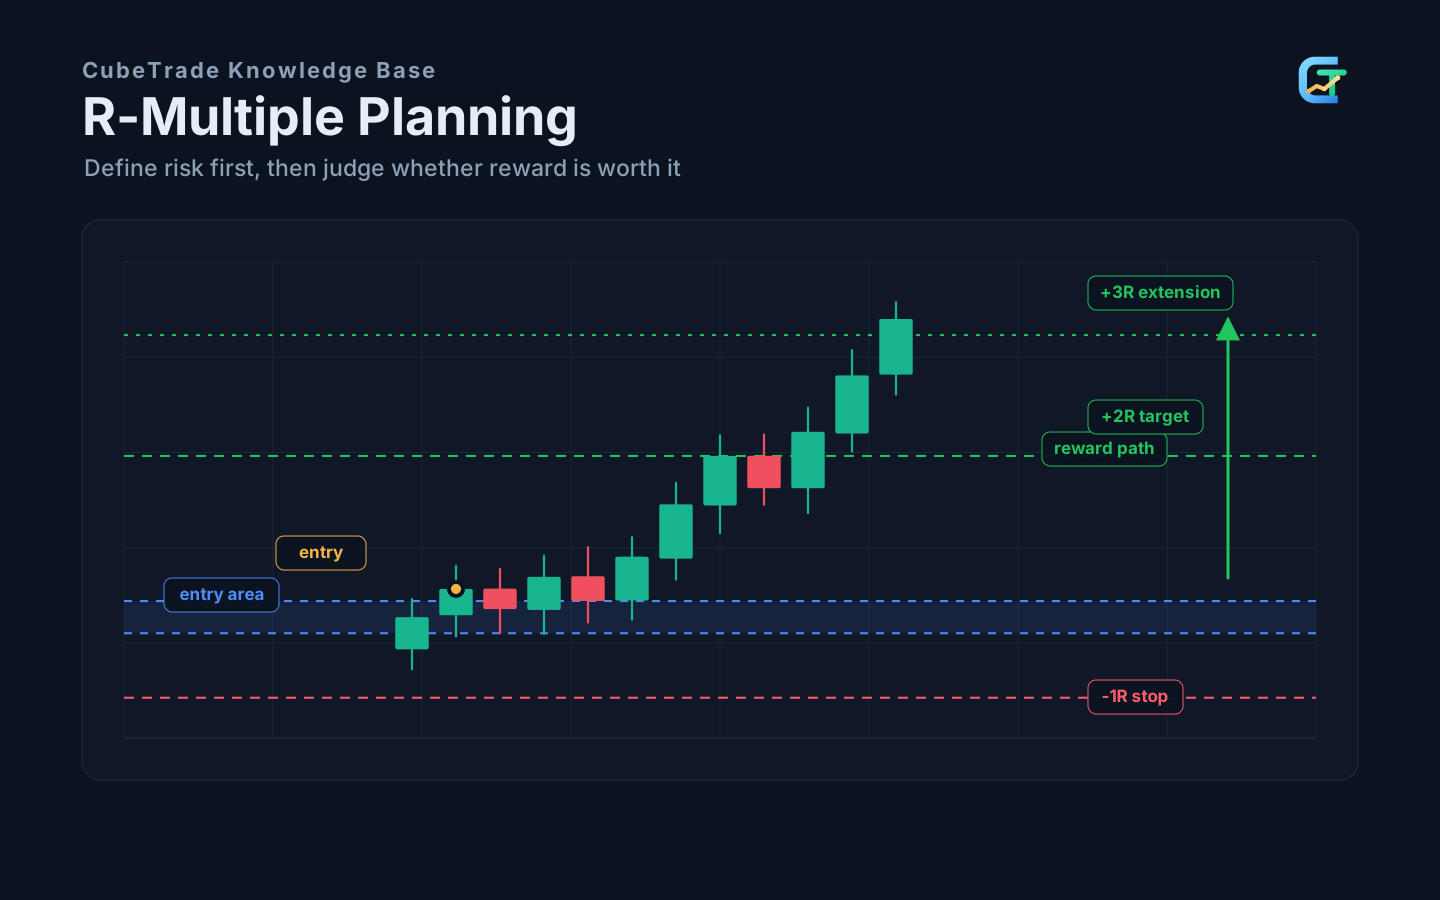
R represents the initial risk of each trade.
If entry is 100 and stop is 96, risk per unit is 4. If target is 108, potential reward is 8, or 2R.
R-multiple allows comparison:
- Trade A earns 200 with 100 risk: +2R.
- Trade B earns 500 with 1000 risk: +0.5R.
Larger money gain is not necessarily better. What matters is gain relative to risk.
Recording R-multiple helps you see:
- Whether average loss exceeds plan.
- Whether winners are cut too early.
- Whether the strategy has positive expectancy.
- Whether execution often deviates from plan.
R must be defined before entry, not reconstructed after exit. Planned R comes from entry, stop, and target. Actual R must be recalculated from real fills, fees, and slippage. If actual losses often exceed -1R, stop execution or position sizing is broken.
8.5 Single-Trade Risk
Single-trade risk is the first line of account survival. A common approach is risking only a small percentage per trade, such as 0.25%, 0.5%, 1%, or lower. The exact level depends on frequency, strategy volatility, experience, and emotional tolerance.
Basic sizing formula:
Allowed loss = account equity * risk percentage
Position size = allowed loss / stop distance per unit
Example:
Account equity: 100000
Risk per trade: 1%
Allowed loss: 1000
Entry: 50
Stop: 48
Risk per unit: 2
Position size: 1000 / 2 = 500 units
This formula forces you to know stop location before entering. If you do not know the stop, you cannot calculate size, and you should not trade.
Position size must not determine the stop. The correct order is: define the structure-failure point, calculate risk per unit, then calculate size. If the size is too small, the trade has too much stop distance. Reduce size or skip; do not move the stop closer just to buy more.
Hard rules for single-trade risk:
- Stop first, size second. Without a stop location, there is no position-size calculation.
- Single-trade loss must stay within account tolerance; do not increase risk because the setup “looks certain.”
- Leverage magnifies the outcome of size; it does not improve analysis quality.
- If normal slippage can make the loss meaningfully exceed planned risk, reduce size or skip the trade.
In review, check whether actual losses often exceed planned losses. If they do, the problem is usually not analysis alone. It may be position sizing, slippage, stop execution, or a product that does not fit the current rules.
8.6 Portfolio Risk and Correlation
Single-trade risk is not enough. Multiple positions may lose together.
For example:
- A tech stock long.
- A Nasdaq ETF long.
- A Bitcoin long.
- A high-beta growth stock long.
They may all be exposed to “risk appetite falling.” If risk appetite worsens, all can drop together.
Portfolio risk includes:
- Total same-direction risk.
- Industry or theme exposure.
- Market risk factor exposure.
- Leverage and margin pressure.
- Liquidity deterioration under stress.
The trade plan should set maximum total risk if all positions stop out together.
Portfolio-level no-trade conditions:
- Several positions use different names but depend on the same market direction.
- Total loss if all positions stop out exceeds the account risk limit.
- One position can create margin pressure and force other positions to be reduced.
- Under stress, liquidity may disappear across positions at the same time, making stop prices unreliable.
Portfolio risk is not about how many symbols you hold. It is about whether they can lose together under the same market shock.
A more practical approach is to group related positions into risk clusters. For example, a tech stock long, Nasdaq ETF long, semiconductor ETF long, and Bitcoin long may all belong to a “risk appetite rising” cluster. Before opening a new position, ask:
- Does this trade depend on the same market factor as existing positions?
- If the same risk cluster stops out together, does total loss exceed the planned limit?
- In stress conditions, can correlation rise and make seemingly diversified positions fall together?
- Should the new position be smaller, or should a lower-quality position in the same cluster be closed first?
Correlation is not a fixed number. Assets that look diversified in calm markets can suddenly move together during panic, liquidity contraction, or macro events. Portfolio risk should be calculated under stress scenarios, not only normal conditions.
8.7 Three Stop Types
First, structural stop.
Place the stop where the trade logic fails. For a long breakout-retest trade, the stop may be below retest support. For a short breakdown retest, above old support turned resistance.
Second, volatility stop.
Use ATR or other volatility tools to set distance. Useful in markets with changing volatility.
Third, time stop.
If price does not move as expected for too long, exit even without price stop. Useful for failed breakouts, momentum trades, and short-term strategies.
A good stop is not the closest stop. It is where the idea is no longer valid.
Once a stop is written into the plan, it should not be widened out of fear. The only valid reason to adjust a stop is that market structure has moved in your favor and allows risk to be reduced or moved to a more logical location.
Stop choice must match the trade model:
- Structural trades should prioritize structural stops because invalidation is clearest.
- Momentum trades can add a time stop because failed continuation is itself information.
- High-volatility instruments can use ATR as a reference, but wider stops must come with smaller size.
Unreasonable stops include stops that are too close to entry, have no structural meaning, exist only to lose less, or are ignored after triggering because the trader still wants to prove the idea right.
A stop is not better because it is closer. It is better when the invalidation point is clearer. If a stop only feels comfortable psychologically but cannot explain why the trade logic fails there, it is not a good stop.
8.8 Take Profit and Trailing Stop
Profit taking can be:
- Fixed R target such as 2R or 3R.
- Previous high/low.
- Higher-timeframe support/resistance.
- Partial profit taking.
- Trailing stop using trendline, moving average, or ATR.
Partial profit reduces psychological pressure but may weaken big winners. Trailing stop lets winners run but may give back profit.
Choose based on strategy:
- High-win-rate small-swing strategies can take profit more actively.
- Trend strategies need more room.
Profit taking should also be planned before entry. Without a target, reward-to-risk cannot be judged. Without a trailing-stop rule, open profit is easily handled emotionally. A target is not “how much I want to make”; it is where planned reward is enough or trend quality starts to decline.
Profit-taking rules must avoid two extremes:
- Too early: taking only small gains every time, so winners cannot cover full losses.
- Too late: price reaches major resistance or momentum clearly weakens, but the plan is ignored out of greed.
A trailing stop must have an objective basis, such as the previous structural low, moving-average defense, ATR trail, or fixed R giveback. Do not change rules casually just because open profit grows, and do not keep hoping after the trend structure has already failed.
Fixed-R targets fit rule-based strategies. Structural targets fit trades with clear previous highs and lows. Trailing stops fit trend continuation, but they should protect profit already earned, not be widened because the trader fears being shaken out. If the strategy relies on large swings, taking profit too early wastes trends. If the strategy relies on small swings, taking profit too late gives gains back.
8.9 Expectancy
Expectancy measures average theoretical result per trade.
Simplified formula:
Expectancy = win rate * average win - loss rate * average lossExample:
Win rate: 40%
Average win: 2.5R
Loss rate: 60%
Average loss: 1R
Expectancy = 0.4 * 2.5 - 0.6 * 1 = 0.4R
Before fees and slippage, average expectancy is +0.4R per trade.
Paper expectancy is not real expectancy. Real expectancy is reduced by:
- Fees.
- Slippage.
- Overnight gaps.
- Funding rates.
- Execution delays.
- Emotional early exits or widened stops.
Expectancy must come from enough comparable trades, not from a few memorable examples. In review, separate at least:
- Samples from the same trade model; do not mix breakout, reversal, and range trades into one number.
- Planned results and real results, with real results including fees, slippage, and funding costs.
- Average win, average loss, largest loss, losing streak, and maximum drawdown.
- Whether profit comes from a few extreme trades; if it does, confirm that the strategy can survive the waiting periods.
If the sample shows that win rate, average R, or execution deviation cannot support positive expectancy, revise the rules or reduce size before continuing.
8.10 Trading Journal
Without a journal, there is no true review. A journal should record:
Date:
Instrument:
Direction:
Timeframe:
Trade model:
Entry reason:
Entry price:
Stop price:
Target price:
Position size:
Planned risk:
Actual exit:
Actual R-multiple:
Was the plan followed:
Error type:
Screenshot:
Review conclusion:
Error types:
- Analysis error: wrong market state.
- Location error: traded away from key area.
- Trigger error: did not wait for confirmation.
- Risk error: stop too wide or size too large.
- Execution error: early profit, moving stop, chasing.
- Emotional error: revenge trading, FOMO, adding after loss.
Review is not self-blame. It is finding rules that can be improved.
An effective journal should produce three types of conclusions:
- Rules to keep: which conditions produce stable trade quality.
- Actions to delete: which entries, add-ons, or stop movements repeatedly create losses.
- Hypotheses to keep testing: which observations look useful but still lack enough samples.
Recording only profit and loss is not review. Useful review reconstructs each trade into three questions: Was the plan complete, was execution consistent, and is the result repeatable?
8.11 Handling Bad Trading Habits
Overtrading:
Set a maximum number of trades per day or week. Overtrading often means emotion needs action.
Revenge trading:
After consecutive losses, enforce rest. Revenge trading tries to make the market repair your emotions.
Moving stops randomly:
Write invalidation before entry. Stops can be tightened when structure moves in your favor, but should not be widened because you fear loss.
FOMO:
Set a no-chase rule. If price has moved far from the planned entry area, wait for the next retest or next trade.
No review:
Review weekly. Focus on rule execution, not short-term P/L.
8.12 Practice
Convert your last 20 simulated or real trades into R-multiples. Calculate:
- Average winning R.
- Average losing R.
- Largest single loss.
- Whether any loss exceeded planned risk.
- Whether winners were cut early.
- Whether losers were held too long.
If losing trades often exceed 1R, the biggest problem is not analysis but execution.