
3.1 Support and Resistance Are Zones, Not Lines
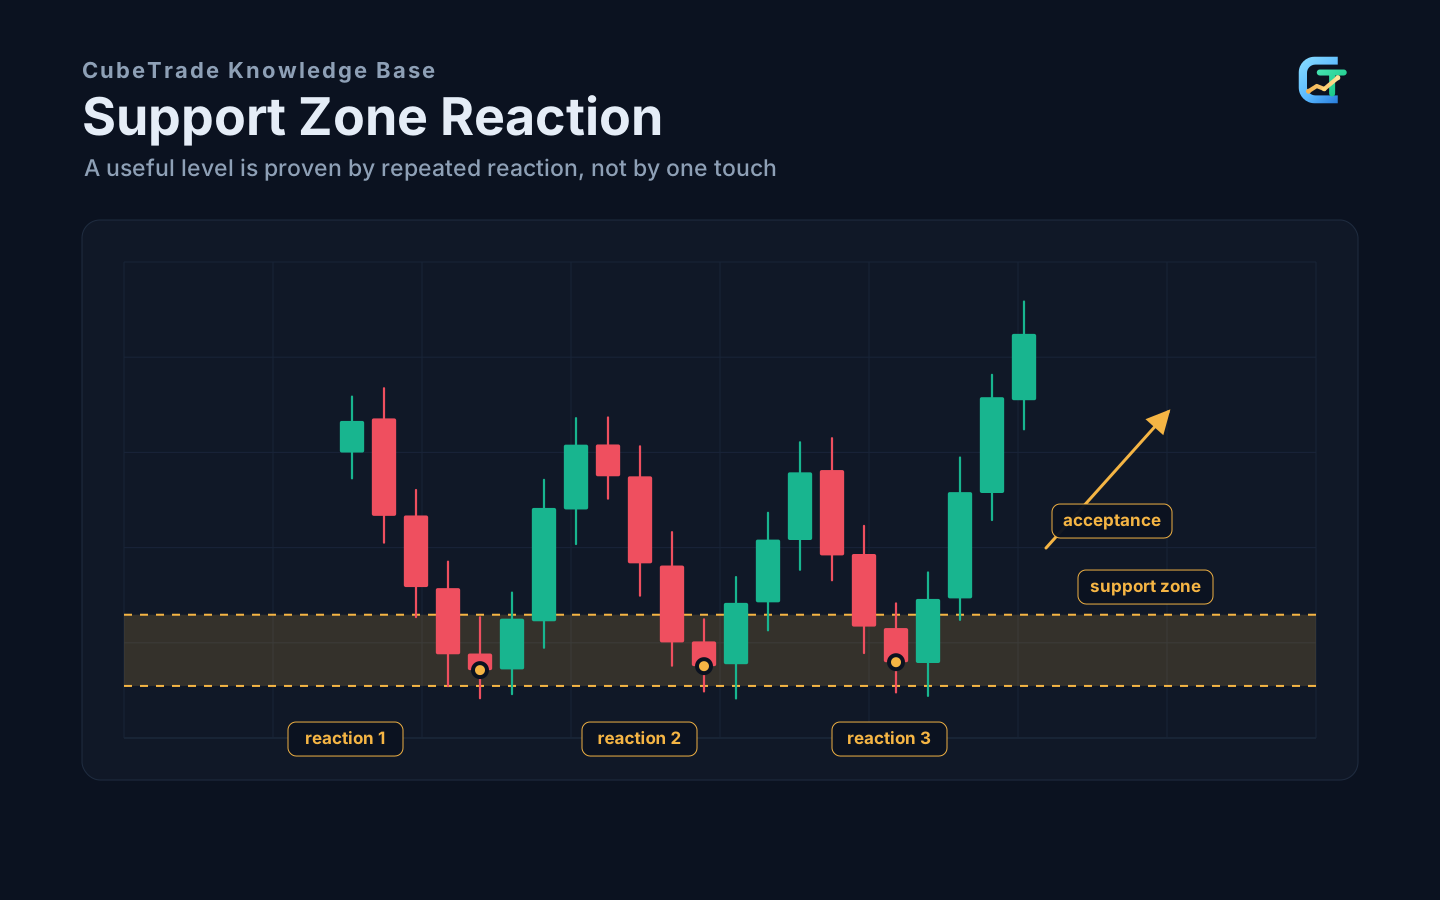
Support is an area where buying pressure becomes stronger after price falls. Resistance is an area where selling pressure becomes stronger after price rises.
They are not exact price points. They are areas where the market repeatedly reacts.
An effective support/resistance area needs at least two conditions:
- Price has produced a clear reaction there, such as a fast reclaim, strong candle, long wick, volume expansion, or structure turn.
- The reaction has happened more than once, or it happened near a higher-timeframe or important swing high/low.
If a level has only one touch and no obvious reversal, volume response, or structure change, it may be a subjective line rather than a market-recognized area. Support and resistance are not “where price touched.” They are where the market reacted.
3.2 Major and Minor Support/Resistance
Support and resistance have hierarchy.
Major support and resistance usually come from higher timeframes, larger ranges, and important swing highs/lows. They affect direction and position size.
Minor support and resistance come from smaller-timeframe local swings. They help optimize entry, add, reduce, and stop.
Example:
- A daily previous high is major resistance.
- A 15-minute pullback low is minor support.
If price approaches daily resistance, even a beautiful lower-timeframe long signal should be handled carefully because higher-timeframe supply may change trade quality.
3.3 Forms of Support and Resistance
Support and resistance are not only horizontal lines.
First, horizontal support/resistance.
This is the most intuitive form. It comes from historical highs/lows, congestion areas, and range boundaries.
Second, trendline support/resistance.
A trendline expresses the slope of price movement. In an uptrend, price retesting the trendline and rising again means the trend rhythm remains.
Third, moving-average support/resistance.
Moving averages are dynamic support/resistance. If price moves along a moving average, the market has built a dynamic cost consensus around it.
Fourth, support-resistance flip.
Former resistance may turn into new support after breakout and successful retest. Former support may turn into new resistance after breakdown and failed reclaim.
Support-resistance flip is the foundation of breakout-retest trading.
3.4 How to Find Support and Resistance
Use this sequence:
- Start from higher timeframes.
- Mark obvious swing highs and lows.
- Find areas where price reacted multiple times.
- Check whether strong candles, long wicks, volume, or trend turns appeared there.
- Draw zones rather than exact lines.
Do not force every wick to fit perfectly. The market is not a geometry problem. The goal is to find areas where behavior truly changed.
3.5 Watch Reaction Quality at Key Areas
Reaching a key level does not mean trading immediately. Watch reaction quality.
Reaction quality can be divided into three levels.
First, low-quality reaction:
- Price touches support, but the rebound is pushed back down.
- The candle leaves a clear upper wick and closes weak.
- Price closes back inside the support area, showing weak acceptance.
- Volume and later candles do not support the move.
Second, observable reaction:
- Price touches support and does not continue breaking down.
- The close remains above the support area or in the stronger part of the area.
- The upper wick is not large, meaning the rebound was not immediately rejected.
- This reaction is worth watching, but it is not yet a high-quality opportunity.
Third, high-quality reaction:
- Price touches support, quickly reclaims, and closes high.
- A strong bullish candle, bullish engulfing candle, long lower-wick reclaim, or lower-timeframe structure turn appears.
- Later candles confirm and price begins to move away from the support area.
- The stop can be placed below the support-failure point, and target space is still sufficient.
The same “support touch” can produce very different trade quality. The logic is symmetrical at resistance: focus on whether the upside attempt fails, whether the close is weak, and whether later candles confirm rejection.
3.6 Do Not Conclude Immediately After Support Breaks
Many traders short as soon as support breaks. But the break itself is not a complete signal.
After a break, several things can happen.
First, weak rebound cannot reclaim old support.
This suggests strong selling pressure and failed support.
Second, rebound reaches the old support area but gets rejected.
If the rebound leaves a long upper wick, weak body, or high-volume stall, old support may have become new resistance. This is a common short setup.
Third, price returns to the support area and buyers fight back.
If price re-enters the support area but has not broken resistance above, it only shows demand below. It is not enough to declare reversal. At this point, it is better to observe whether bullish candles, lower-timeframe structure turn, or resistance breakout appears later.
Fourth, price breaks down, quickly reclaims, and breaks resistance above.
This may be a false breakdown and bullish reversal, showing demand below.
The second move after the break is more important than the break itself. Failure to reclaim support is weak. Reclaiming support and then being rejected means support may have become resistance. Reclaiming support without breaking resistance is only observation. Reclaiming and then breaking resistance is closer to a false-break reversal into strength.
3.7 Judging Strength of Support and Resistance
Not all levels matter equally. Judge strength from five angles.
First, higher timeframe means more importance.
Weekly and daily swing levels usually matter more than five-minute fluctuations. Lower-timeframe signals should respect higher-timeframe locations.
Second, stronger reaction means more importance.
If price quickly reverses from an area multiple times, the market has clear conflict or demand there.
Third, number of touches should be moderate.
Multiple touches show attention, but too many touches may also consume the level. If support is tested repeatedly and each bounce gets weaker, the chance of breakdown may rise.
Fourth, whether other tools overlap.
Horizontal support, trendline, moving average, Fibonacci, and previous-high retest in the same area increase observation value. But overlap is not automatic entry.
Fifth, whether there is space.
Shorting close to support or buying close to resistance may have poor reward-to-risk even if direction is right.
3.8 More Lines Are Not Better
A chart full of lines looks professional but often has no decision value. If every area is a key level, any trade can be justified.
Prioritize:
- Major support/resistance from higher timeframes.
- Recent swing highs/lows on the trading timeframe.
- Only levels useful for future plans.
- Remove levels price has moved far away from.
A clear chart usually needs only a few key zones. Trade plans depend on clean boundaries, not many lines.
3.9 Three Outcomes at a Key Area
After price reaches a key area, there are usually three outcomes.
First, bounce or rejection.
The level is temporarily valid. Observe reversal candles, engulfing patterns, wicks, volume, or lower-timeframe turns.
Second, breakout and acceptance.
The old boundary is repriced. Wait for retest and support-resistance flip.
Third, pierce and reclaim.
This is common in false breakouts or liquidity sweeps. The value comes from a failed breakout. A failed upside breakout may trap buyers; a failed downside break may trap sellers.
A key level is not an order. It is an observation window.
3.10 Turning a Key Level into a Trade Plan
Suppose price approaches a daily resistance area. A complete plan can be written:
Context: Daily chart is in an uptrend, but price is near previous high resistance.
Location: Resistance zone is between 100 and 103.
Long plan: If the daily candle closes above 103 and a retest near 103 holds, look for bullish confirmation on lower timeframes.
Short plan: If price pierces 103 but closes back below 100 with bearish engulfing, observe a short-term pullback.
No-trade condition: If price chops between 100 and 103 without clear close confirmation, do not trade.
Risk: Chasing longs near resistance has limited space; countertrend shorts should be short-term only.
This is better than “short at resistance” because it allows the market to give different answers.
3.11 Practice
Find a historical chart, remove indicators, and do three things:
- Draw major higher-timeframe support/resistance with thick lines.
- Draw minor trading-timeframe support/resistance with thin lines.
- Next to each key area, write whether you observe bounce, breakout, retest, or no trade.
If you cannot write a no-trade condition, the area is not yet a real trade plan.