
7.1 Moving Averages
Moving averages are smoothed expressions of average price, used to observe trend direction and dynamic support/resistance.
Short-term averages are more sensitive and useful for short-term rhythm. Mid-term averages help observe trend pullbacks. Long-term averages help judge the major trend line of defense.
Moving-average crosses are not trend beginnings. They are lagging confirmations after price has already changed.
Better use:
- Use moving averages to judge trend background.
- Use them to find pullback observation areas.
- Use price action to confirm whether they hold.
- Do not enter from moving averages alone.
Moving-average signals must obey price structure. The important question is not whether averages crossed, but whether price has already formed structural breakout, whether the retest holds, and whether moving-average slope supports the current direction. If price keeps chopping through flat averages and support/resistance boundaries are unclear, most moving-average signals are range noise.
7.2 Fibonacci
Fibonacci retracement is a location tool.
Common observation areas:
- 0.382: shallow pullback, often in strong trends.
- 0.5: normal pullback.
- 0.618 to 0.65: golden pocket.
- 0.786, 0.886: deep pullback.
Ratios do not predict that price must bounce. What matters is whether price reacts after reaching the area.
Fibonacci requires three conditions: a clear trend, a clear swing start and end, and a market reaction after price reaches the retracement area. Without trend, retracement ratios often turn random range movement into fake opportunity. If price reaches 0.618 or 0.65 and shows no demand, or effectively breaks the previous low, the ratio area has not been accepted.
The meaning of 0.618 to 0.65 is not that the numbers are magical. It means the pullback is already relatively deep but, in theory, has not broken trend structure. What matters is whether this area overlaps with a previous-high retest, trendline, moving average, or horizontal support, and whether there is a long lower wick, engulfing candle, high-volume reclaim, or lower-timeframe structure turn after price arrives. If price shows no reaction at 0.382, 0.5, or 0.618 and finally bounces near 0.786, that does not make 0.786 more magical; more likely, it happened to overlap with structural support and market reaction.
Fibonacci cannot define entry by itself. A ratio level only says “observe here,” not “trade here.” If price reaches the ratio area without demand, or breaks it and then cannot reclaim, the ratio level has failed.
7.3 RSI, MACD, and Divergence
RSI and MACD both observe momentum changes, but they should not decide trades alone.
Divergence means price and indicator momentum are out of sync. For example, price makes a new low but the indicator does not, suggesting downside momentum may weaken.
Divergence has trading value when:
- It appears near key support/resistance.
- It overlaps with structural turn.
- A confirmation candle appears.
- It fits timeframe context.
In strong trends, divergence can appear repeatedly while price continues.
Divergence is not an entry signal; it is a momentum warning. It becomes useful only when it appears at a key location and is followed by a structural turn or confirmation candle. If price still follows the original trend and swing structure has not changed, trading against the trend only because of divergence is usually premature top or bottom picking.
7.4 ATR and Bollinger Bands
ATR measures volatility, not direction. It helps with stops and position sizing.
When volatility is high, a stop that is too close is easily hit by noise. When volatility is low, stops can be relatively tighter.
Bollinger Bands observe relative price location and volatility expansion/contraction.
In ranges, upper/lower bands may be reversal observation areas. In trends, breaking the upper/lower band may mean acceleration, not reversal.
ATR and Bollinger Bands do not tell direction. ATR answers “how large is current volatility?” Bollinger Bands answer “where is price relative to its own volatility range?” If trend or range state is not judged first, trading only because price touches the upper or lower band can mean fading a trend or chasing a range boundary.
Bollinger Bands must be used differently depending on market state. In a range, the upper and lower bands can act as boundary observation areas, but the real edge often comes from abandoning the middle and only considering a plan near the bands after reaction appears. In a trend, price riding the upper or lower band often means trend acceleration, not automatic reversal. The middle band then behaves more like a dynamic rhythm line, useful for observing whether the pullback is still being caught by the trend.
The wrong use is: short because price touches the upper band, or buy because price touches the lower band. The better use is: first decide whether the market is trending or ranging, then check whether support/resistance, candle reaction, and risk boundary exist near the band.
7.5 Measured Move
Measured move estimates target areas.
Method:
- Find the previous complete move.
- Record its gain or drop.
- Copy that distance from the new starting point.
- Get a target reference area.
It is expectation management, not prediction. Targets still need support/resistance and reward-to-risk.
7.6 Correct Role of Indicators
Indicators are formulas applied to price, volume, or volatility. They help observe more consistently but cannot replace price structure.
Common uses:
- Trend filter: moving averages, MACD.
- Momentum: RSI, MACD, divergence.
- Volatility: ATR, Bollinger Bands.
- Location support: Fibonacci, moving averages, Bollinger middle band.
- Stop support: ATR and structural highs/lows.
Common mistakes:
- Believing indicators lead price.
- Ignoring trend versus range.
- Using multiple indicators that all repeat the same price information.
- Changing parameters constantly.
- Trading crosses without location or structure.
More indicators do not mean stronger confirmation.
Before adding an indicator to a plan, ask what information it actually adds. If moving averages, MACD, and the Bollinger middle band all express price averages, they are not three independent confirmations. Real confirmation should come from different dimensions: structure, location, candle reaction, volume, volatility, and risk boundary.
Before an indicator enters a trade plan, it must satisfy at least four conditions:
- The question it answers must be clear, such as trend, momentum, volatility, or location, not “it looks safer.”
- Parameters must be fixed; they should not change after a few losing trades.
- Indicator signals must be paired with price structure; they should not be used without key levels, market state, and candle reaction.
- Invalidation must be written, such as moving-average failure, failed divergence, or sudden volatility expansion that makes execution cost uncontrolled.
No-trade conditions should also be explicit: several indicators agree but all repeat the same price-average information; the signal appears away from key location; no definable stop exists after the signal; or the indicator direction conflicts with higher-timeframe structure.
7.7 Practical Moving-Average Layers
Moving averages can be short, medium, and long term.
Short-term averages such as 5, 10, and 20 periods observe short rhythm but are noisy.
Medium averages such as 50 or 55 periods observe main pullback rhythm.
Long averages such as 100 and 200 periods filter major trend. Price above the 200-period average often suggests stronger background; below suggests weakness. But it is still a filter, not an entry order.
Consistency matters. EMA or SMA can both be used; do not change parameters after every loss.
Once a moving-average rule enters a trade plan, its invalidation condition must also be written. For example, “buy a pullback to the 20 EMA in an uptrend” should not fail merely because price dips. A clearer invalidation is: “price closes below the 20 EMA, cannot reclaim quickly, and lower-timeframe lows break structure.” Without invalidation, moving averages easily become an excuse to hold losing trades.
7.8 RSI Reading
RSI is a momentum oscillator. Common default period is 14, but the number is not magic.
Common RSI uses:
- Observe overbought/oversold in ranges.
- Observe pullback depth in trends.
- Use divergence to observe momentum weakness.
- Use the 50 line to observe rhythm.
Mistakes:
- Overbought does not mean short immediately.
- Oversold does not mean buy immediately.
- Strong trends can keep RSI high or low for a long time.
- Divergence may appear repeatedly before reversal.
Better use: price reaches a key level, structure changes, and RSI supports the momentum view.
RSI is most often misused in strong trends. In an uptrend, overbought RSI can mean strength continuation. In a downtrend, oversold RSI can mean sellers remain strong. RSI overbought/oversold and divergence matter more near range boundaries, trend exhaustion, or key levels.
For RSI divergence to enter a candidate plan, “location + structure + confirmation” should appear together. Divergence without key support/resistance is no trade. Divergence without swing-structure change is no trade. Divergence without a confirmation candle or failed breakdown/breakout reclaim is no trade. RSI warns about momentum change; it does not announce reversal before price does.
7.9 MACD Reading
MACD observes trend momentum through differences between fast and slow moving averages. It is more trend-confirming and more lagging than RSI.
Common observations:
- MACD line and signal line cross.
- Histogram expands or contracts.
- Above or below zero line.
- Price and MACD divergence.
MACD answers whether trend momentum is strengthening or weakening. It should not answer “buy now” by itself.
MACD crosses are lagging confirmation. A bullish cross is not the start of an uptrend, and a bearish cross is not the start of a downtrend. Price structure usually changes first; MACD confirms momentum later. A better workflow is: first check whether price has broken key structure, then check whether MACD supports that direction.
MACD is better for filtering whether a trend still has momentum, not for chasing every cross in a range. When price chops around the zero line, MACD and signal lines tangle tightly, and histogram bars expand and shrink without continuity, momentum has no directional edge. In that state, MACD should be downgraded to noise, not used as an entry trigger.
7.10 ATR Stops and Position Sizing
ATR measures volatility, not direction. Its practical use is adapting stops and position size to volatility.
Example: if ATR is 2 and your strategy requires a stop of at least 1.5 ATR, the stop distance is about 3. If account risk per trade is 1000, position size is:
Position size = allowed loss / stop distance per unit
Position size = 1000 / 3 = 333 units
Real trading also needs minimum unit, fees, slippage, gaps, and leverage rules.
ATR stops help avoid being stopped by normal noise in high volatility and avoid taking meaningless risk in low volatility. Wider ATR stops also reduce position size, and traders must accept that constraint.
ATR stops must not be used to tolerate larger account losses. When stop distance widens, position size must decrease. If the reduced size makes the trade unattractive, skip the trade instead of expanding account risk to keep size large.
ATR also should not be compared directly across instruments with different price levels. A 2-dollar ATR on a 100-dollar stock and a 2-dollar ATR on a 10-dollar stock represent very different volatility percentages. Across instruments, use ATR relative to price, or recalculate planned risk, stop distance, and position size from the sizing formula.
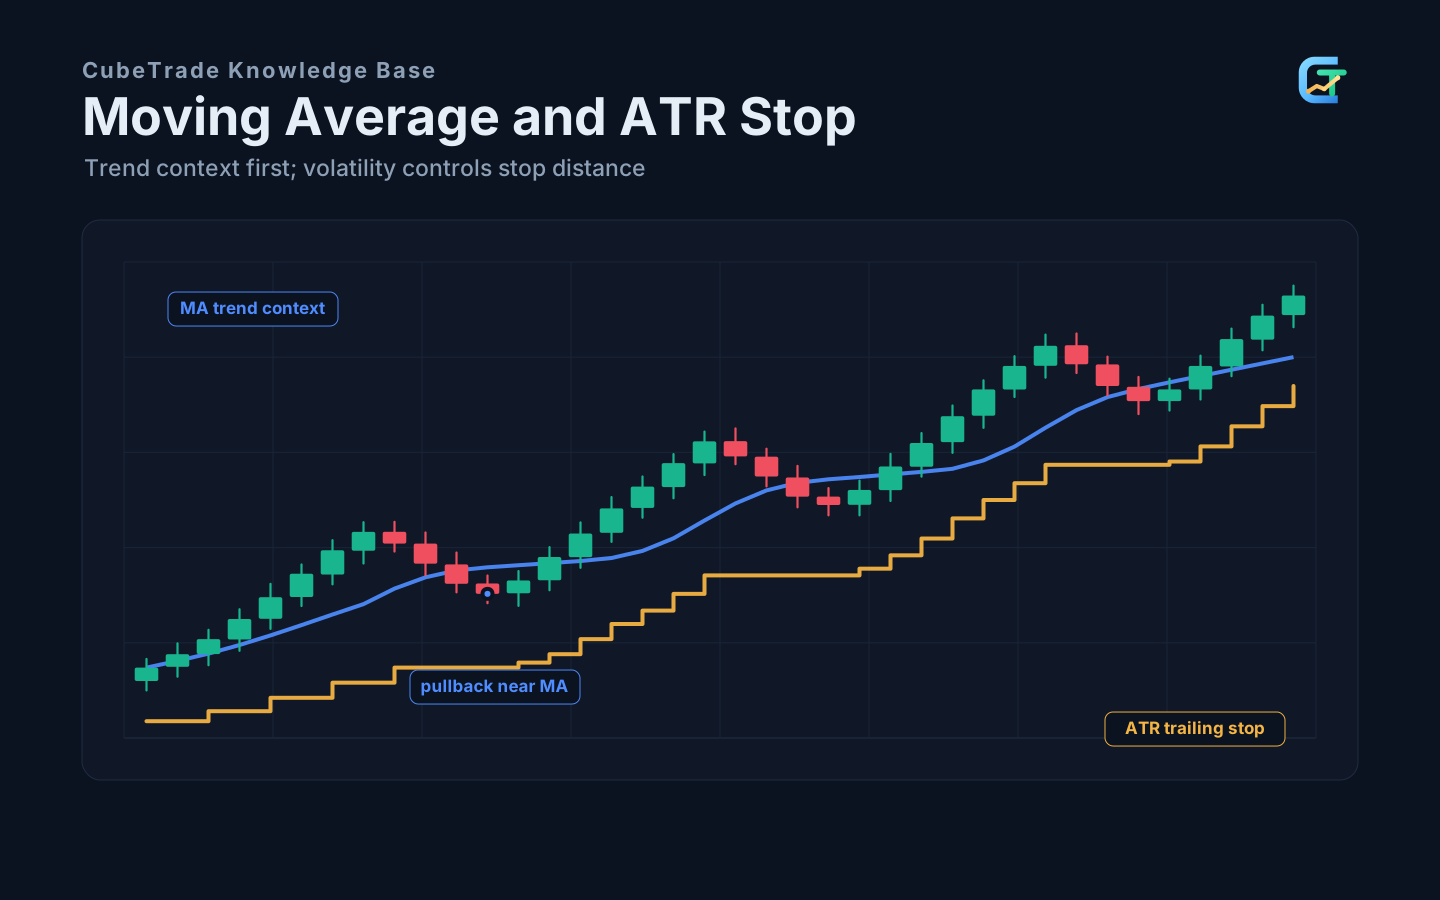
ATR can also be used for trailing stops, but initial stops and moving stops must be separated. The initial stop defines maximum risk before entry. A trailing stop is used after price has moved in your favor, gradually tightening risk or protecting profit. A reasonable trailing stop should only tighten as the market develops favorably; it should not be widened temporarily because price is close to hitting it. If the ATR stop line is broken by normal volatility and structure has also weakened, exit by rule instead of increasing the ATR parameter to prove you are still right.
7.11 Practice
Choose an instrument and load moving averages, RSI, MACD, ATR, and Bollinger Bands. Do not search for signals immediately. Answer:
- What question does each indicator answer?
- Which indicators repeat the same information?
- Which is more useful in trends?
- Which is more useful in ranges?
- Which helps with stop or position sizing?
The goal is to reduce indicator worship and restore indicators to tools.